Inventory Turnover, DOH, DIO, DSI & DII: What They Really Mean for Your Business
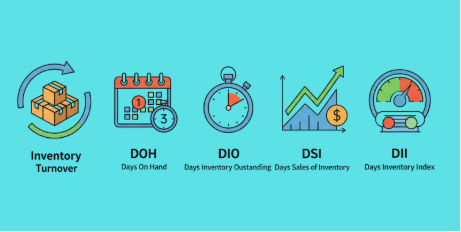
If you question whether your inventory sells quickly or just stays on shelves as dead stock, you are not alone. All businesses face the same issues. To resolve this and to tell if your inventory is in good condition or not, metrics like Inventory Turnover, Days on Hand (DOH), Days Inventory Outstanding (DIO), Days Sales of Inventory (DSI), and Days Inventory Investment (DII) can be used.
Inventory Turnover
Inventory turnover is basically how many times you sell and replace your inventory during a year. (Formula: Inventory turnover = Annual Cost of Goods Sold (COGS) / Average Inventory) For example, let's say your annual COGS is $1 million, and average inventory is $200K. Then, the inventory turnover is 5 turns (1,000,000 / 200,000). In other words, your business sells through its inventory five times a year.DOH (Days of Inventory on Hand)
If turnover tells you how many times stock moves in a year, DOH tells you how many days inventory is sitting before it’s being sold. (Formula: DOH = 365 / Inventory Turnover)For example: If turnover is 5 as above example, then DOH is 73 days (365/5). Therefore, on average, your inventory stays in stock for about two and a half months.
Calculate Your Inventory Turnover and Days on Hand
GearChain helps keep the inventory data behind these calculations accurate with barcode scanning and spreadsheet synchronization.
DIO, DSI, and DII: Different Names, Same Concept
You’ll often hear other acronyms for the same calculation: DIO (Days Inventory Outstanding), DSI (Days Sales of Inventory), DII (Days in Inventory) but basically these are the same as DOH. All refer to the average duration that inventory remains before being sold. Using the example above, all of them come out to 73 days.Why These Numbers Matter
The numbers show more than just accounting terms; they tell a story about your business.1/ About cash flow - When inventory moves fast, a small amount of cash stays in unsold products.
2/ To control costs - Holding inventory for a small number of days helps cut expenses for storage, insurance along with other holding fees.
3/ About business risks - A slow turnover rate could show problems such as too much stock, bad forecasts, or weak demand.
Consider them a regular check of your inventory. When the numbers are good, operations are easy and cash flow is better.
How to Improve Inventory Turnover
Keep inventory quantities current
Record receipts, sales, transfers, consumption, and adjustments consistently. Inaccurate quantities can distort average inventory values and produce unreliable turnover calculations.
Review performance by SKU
A company-wide turnover number can hide individual products that remain unsold. Review movement at the SKU level to identify products that require different purchasing or promotional decisions.
Establish appropriate reorder levels
Reordering too early increases inventory investment, while ordering too late increases stockout risk. Use actual stock activity and lead times when planning replenishment.
Improve demand planning
Review historical inventory activity, seasonal changes, customer demand, and planned sales activity before making purchasing decisions.
Reduce unnecessary manual updates
Barcode scanning and synchronized inventory records can make it easier to capture stock activity consistently instead of reconstructing it later from disconnected records.
Turn Inventory Metrics into Better Decisions
Inventory turnover and days on hand tell you how efficiently inventory is moving, but calculating these metrics is only the beginning. Businesses also need accurate quantities, consistent stock-movement records, and a practical process for acting on the results.
GearChain helps businesses track physical inventory with mobile barcode scanning, maintain synchronized spreadsheet records, and analyze inventory information from one connected workflow.