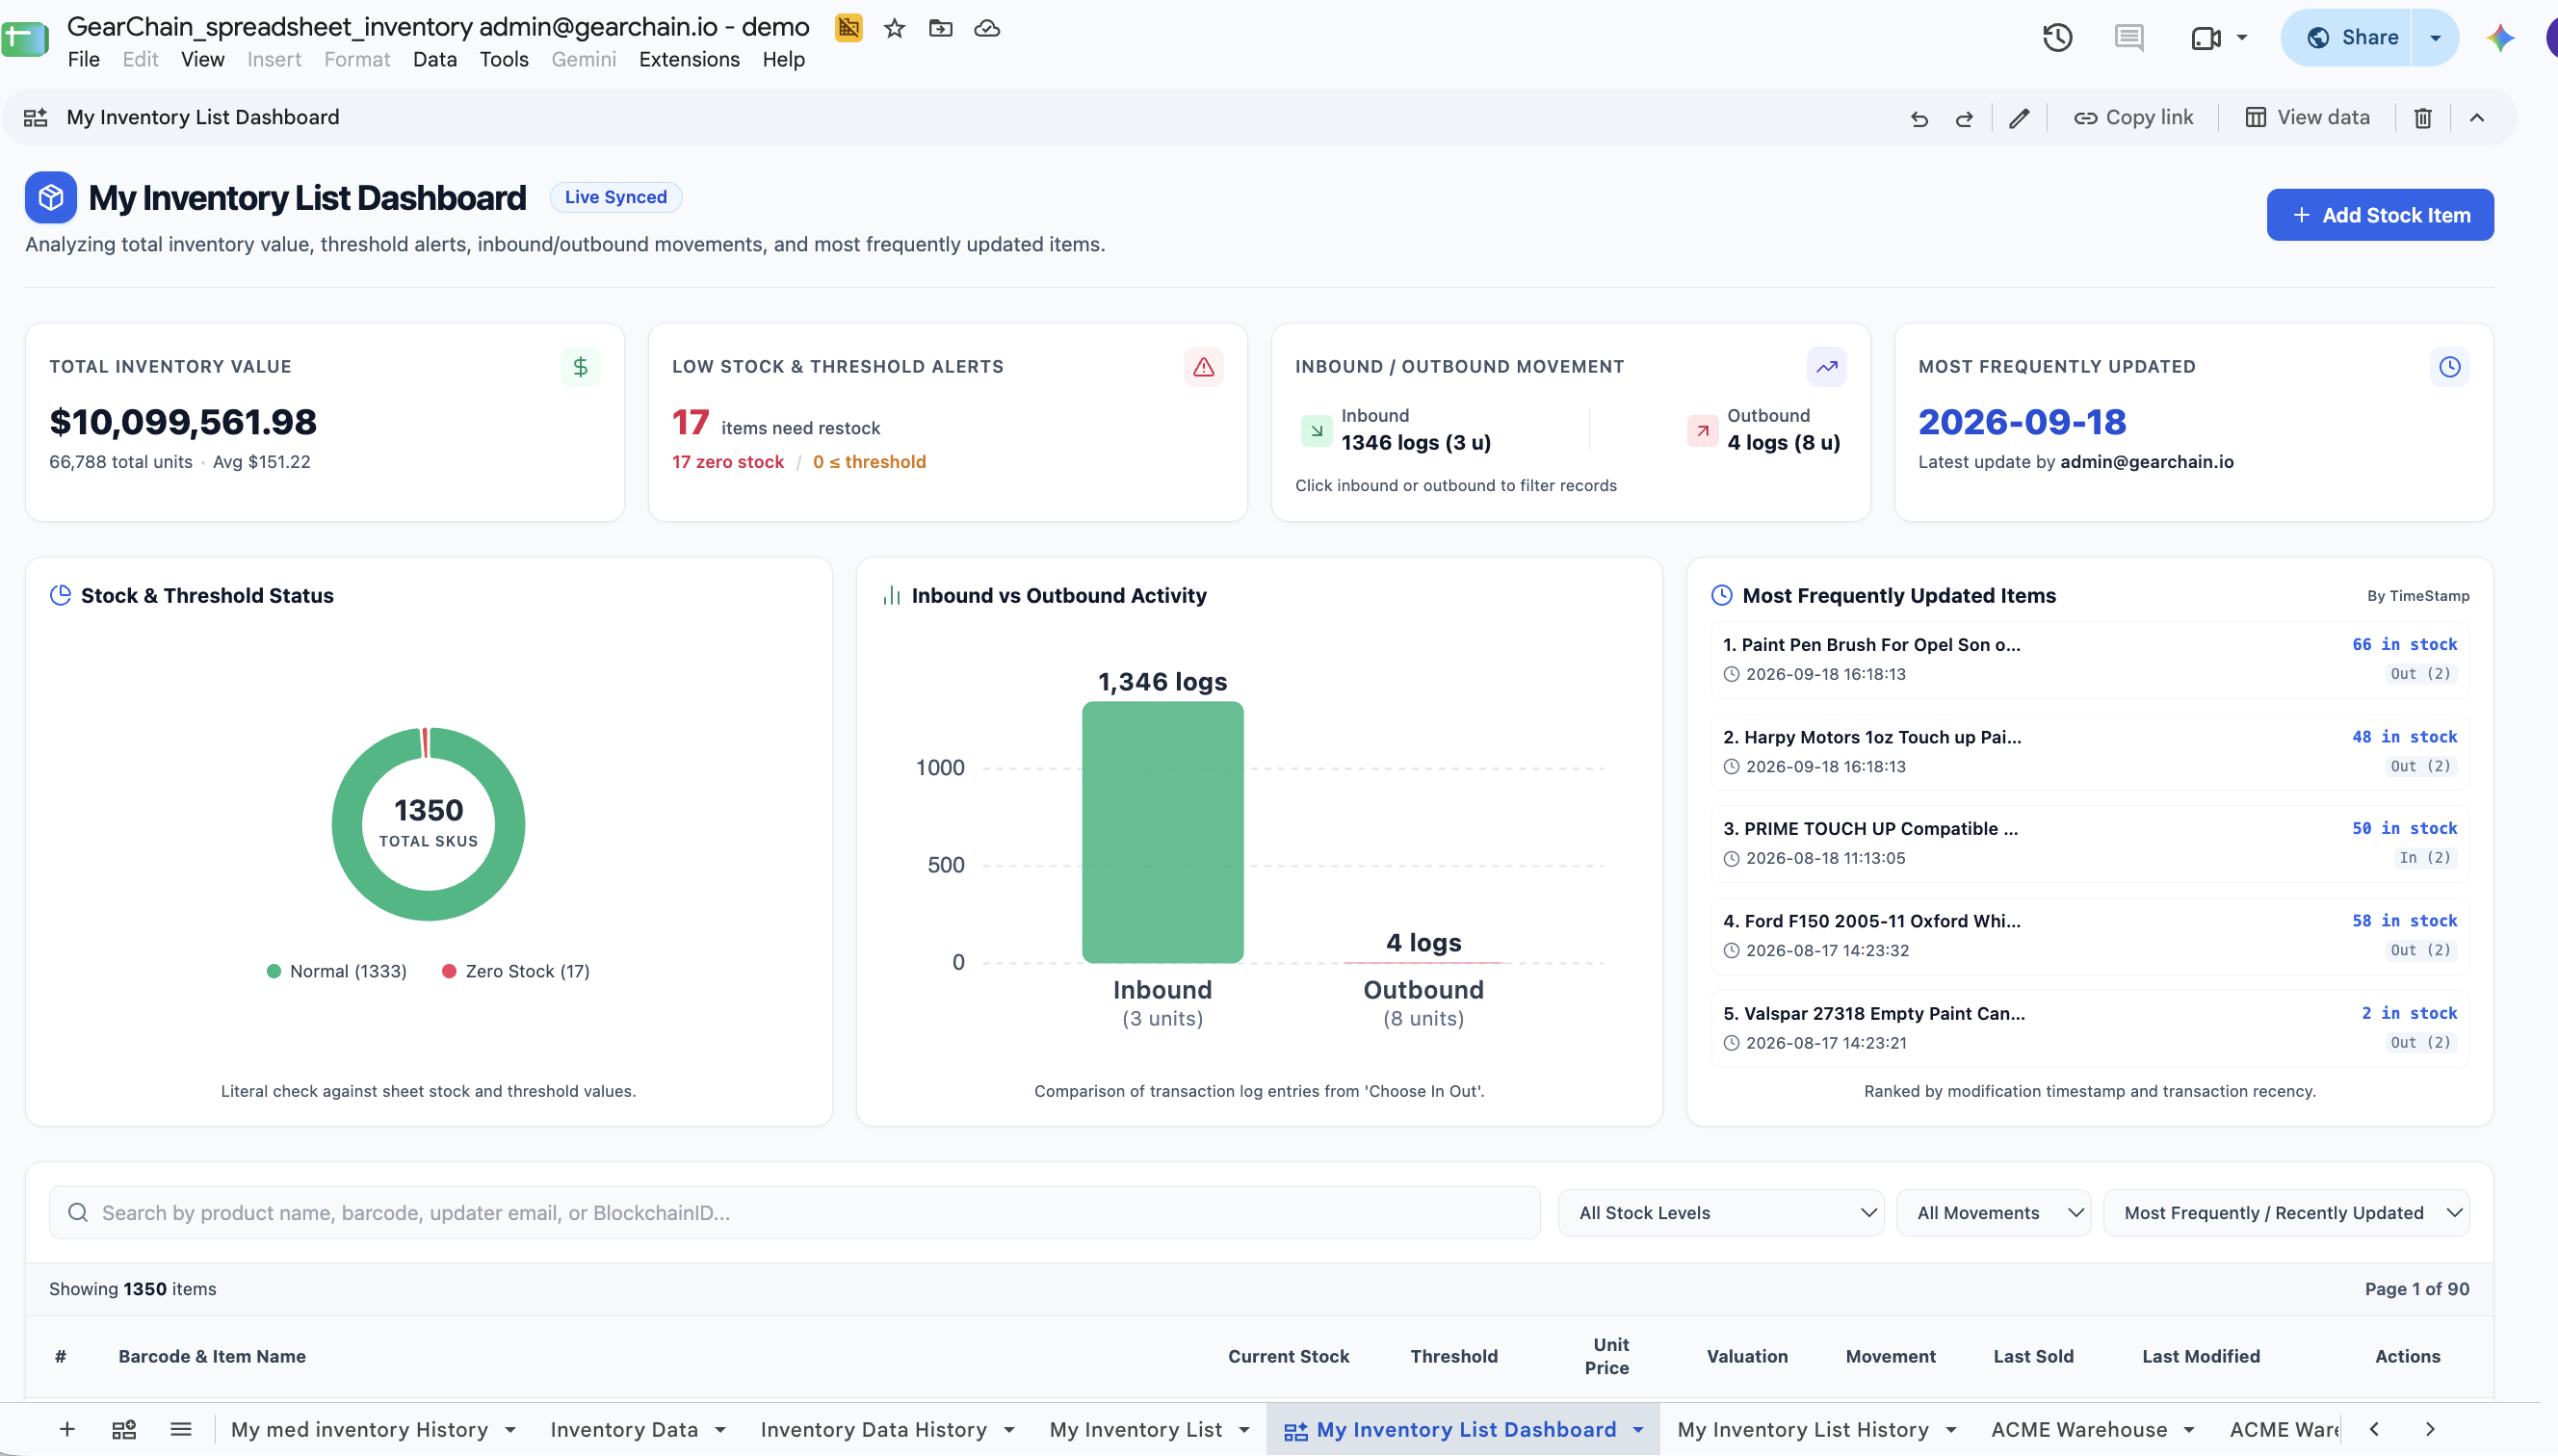
Managing inventory in Google Sheets just became more visual.
Google Sheets Canvas is a Gemini-powered feature that turns spreadsheet data into interactive, read-write mini-apps such as dashboards, Kanban boards, calendars, galleries, and other visual layouts. Instead of manually creating formulas, charts, and reports, users can describe what they want in natural language and let Gemini build the interface from their Sheet data. Changes to the underlying Sheet can also appear in the canvas in real time.
When you combine Google Sheets Canvas with GearChain, you can create an AI-powered inventory dashboard while continuing to manage day-to-day inventory through barcode scanning, mobile devices, and the GearChain web app.
How GearChain + Google Sheets Canvas Works
GearChain can automatically sync your inventory and asset data with Google Sheets.
For example, your GearChain inventory form might contain:
- Barcode and item name
- Current stock
- Minimum stock threshold
- Unit price
- Inbound and outbound activity
- Last sold date
- Last modified date
Once your GearChain form is connected and Google Sheets AutoSync is enabled, inventory updates made through GearChain can be reflected in the connected spreadsheet. GearChain creates worksheets containing current inventory data as well as inventory activity history.
From there, creating an inventory dashboard is straightforward.
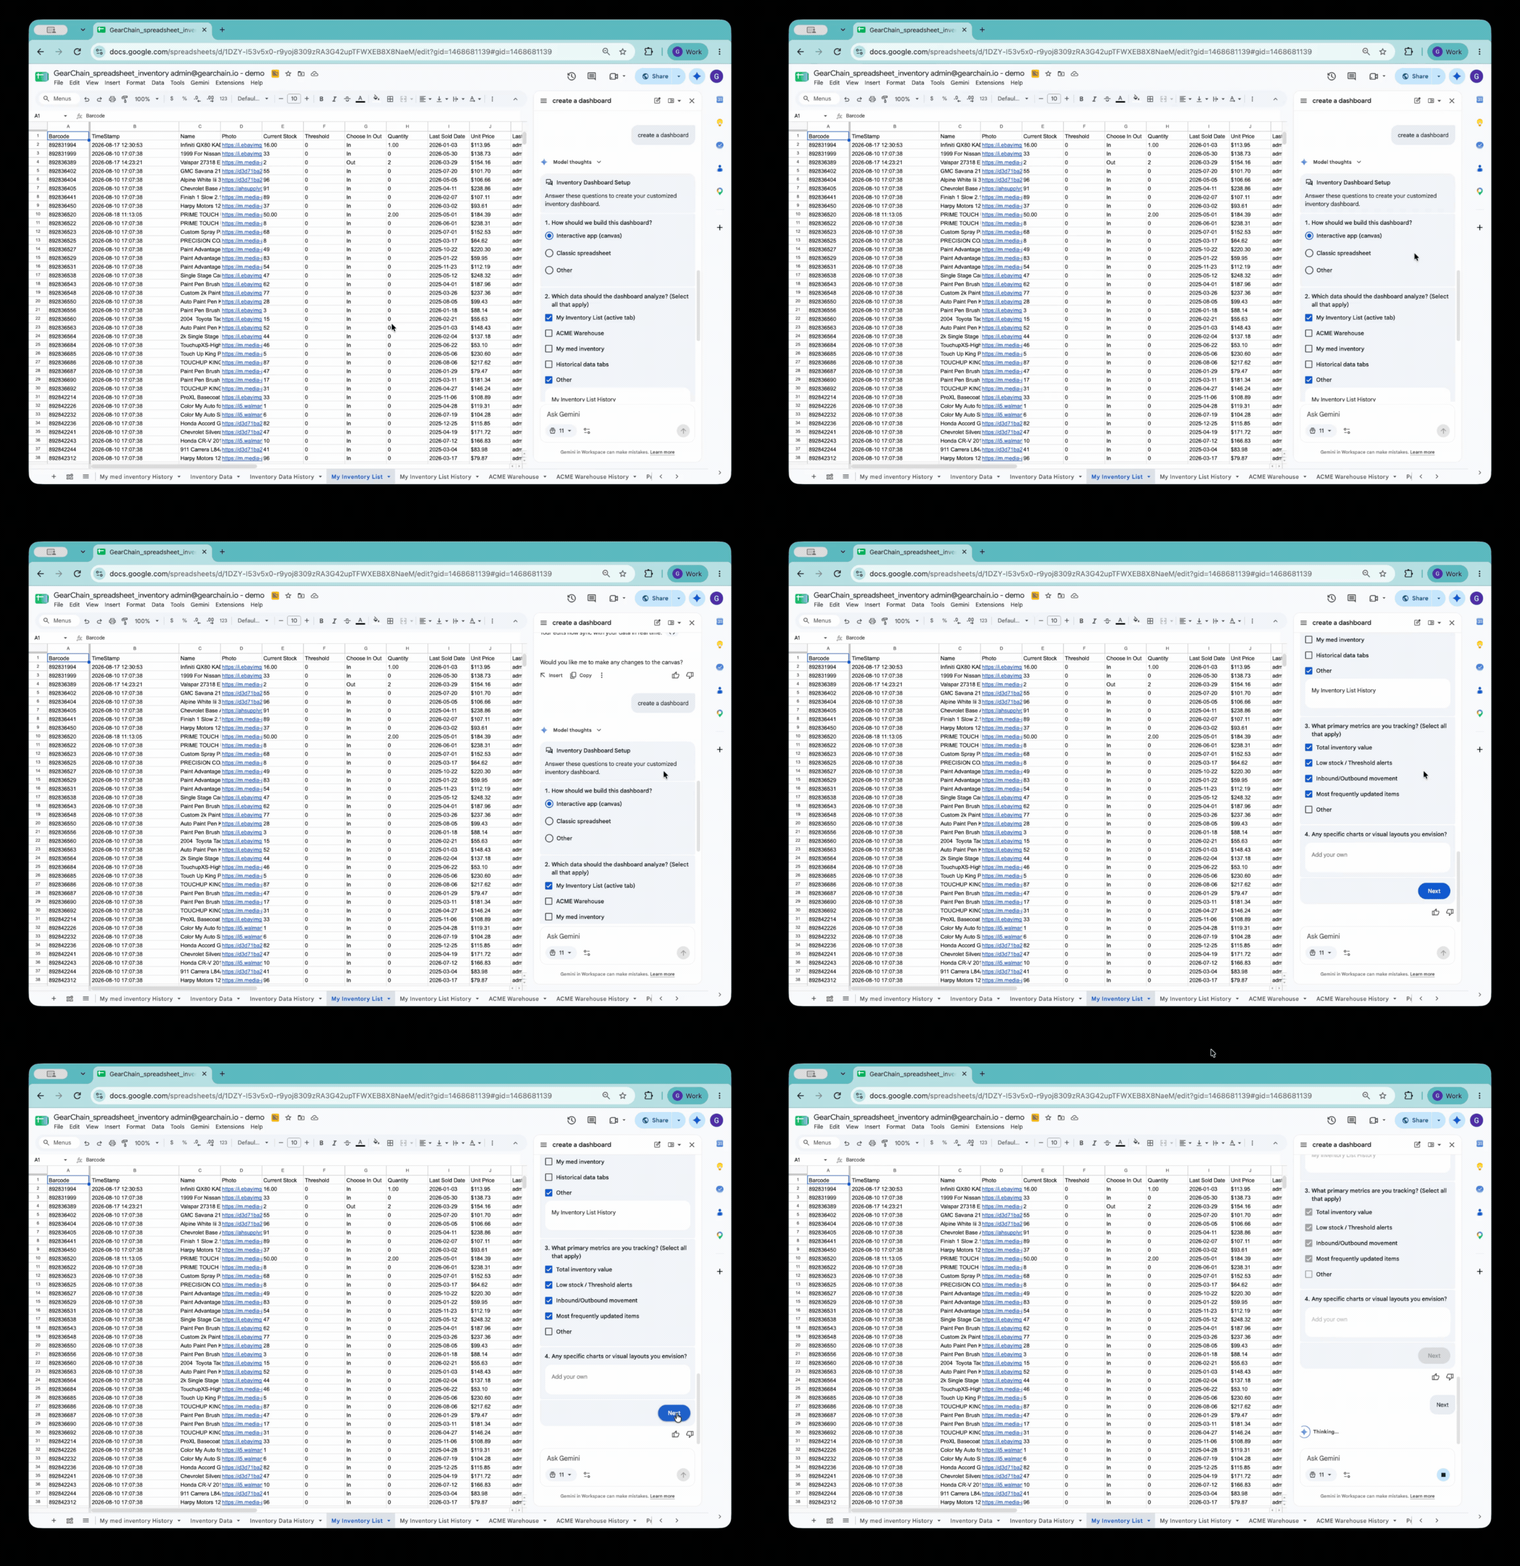
Open your synced GearChain spreadsheet in Google Sheets and create a new Sheets Canvas. Then ask Gemini something as simple as:
Create a dashboard.
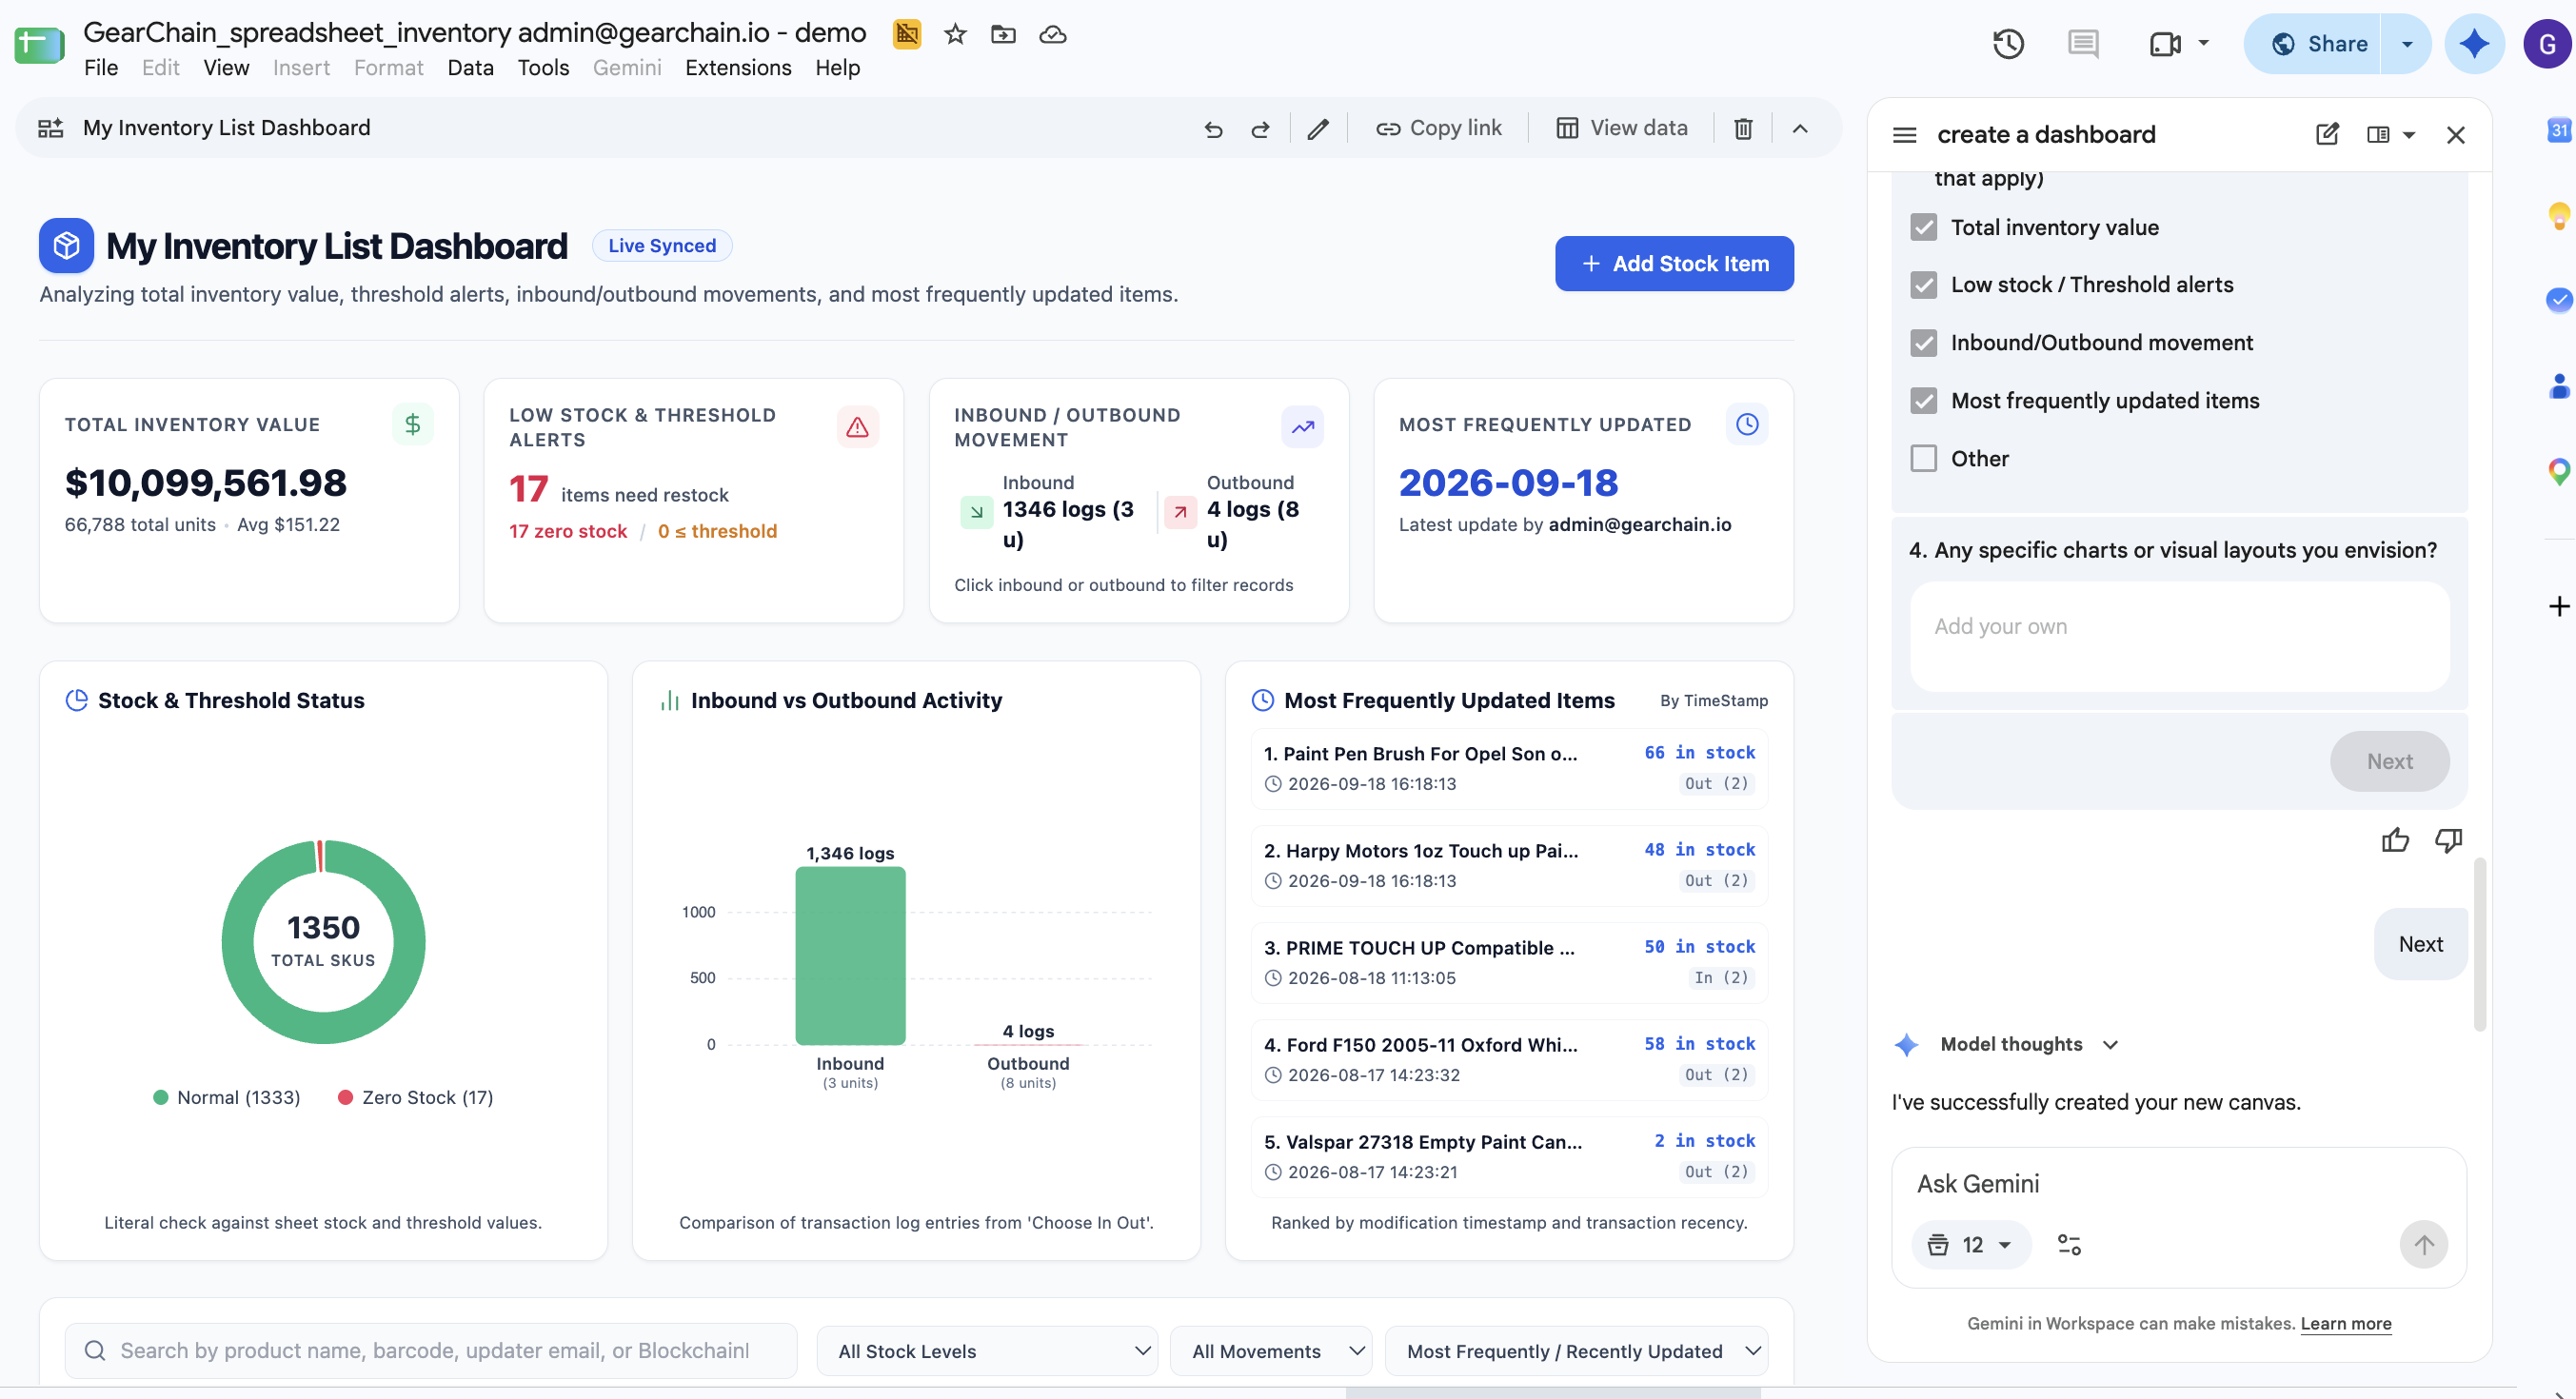
Select the GearChain worksheet containing the inventory data you want to use, and Gemini can generate an interactive dashboard without requiring you to manually build charts and visualizations from scratch.
Google Sheets Canvas can visualize inventory-related metrics such as stock levels, pricing, valuations, low-stock alerts, and inventory activity, making it particularly useful for inventory management.
For instructions on connecting, importing, exporting, and automatically syncing GearChain with Google Sheets, see our Google Sheets Sync Guide .
Why Not Just Manage Inventory Directly in a Spreadsheet?
A dashboard is only as useful as the inventory data behind it.
When employees manually enter every inventory movement into spreadsheet rows, businesses can still face missed updates, incorrect quantities, delayed data entry, and outdated information.
GearChain adds an operational inventory layer in front of the spreadsheet. A warehouse employee can scan a barcode when inventory arrives, a store employee can update stock from a mobile device, and a manager can work from the web app.
With Google Sheets AutoSync enabled, GearChain inventory updates can flow into the connected Sheet, which can then power your Sheets Canvas dashboard.
Barcode Scan → GearChain → Google Sheets → AI-Powered Dashboard
This allows frontline teams to focus on scanning and inventory operations while managers use Google Sheets for reporting, visualization, and analysis.
Inventory Dashboard Use Cases
Retail Inventory and Restocking
A retailer can create a dashboard showing total inventory value, zero-stock products, items below their minimum stock threshold, and recent inventory movements. Managers can quickly identify products that may need restocking without searching through hundreds or thousands of spreadsheet rows.
Warehouse Inbound and Outbound Tracking
Warehouse teams can scan products as inventory moves in or out. A Sheets Canvas dashboard can visualize inbound versus outbound activity, current stock levels, and recent transactions, giving operations teams a faster way to understand inventory movement.
Multi-Location Inventory
Businesses operating multiple stores, warehouses, service vans, or job sites can maintain separate GearChain forms and create dashboards for the inventory data they need to monitor.
For example, a regional manager could review inventory value and low-stock conditions without requiring staff at each location to manually prepare a report.
From Inventory Spreadsheet to Inventory App + AI Dashboard
Google Sheets Canvas makes spreadsheet data easier to visualize and interact with. GearChain adds barcode scanning and inventory workflows that help keep the underlying data current and operationally useful.
Together, businesses can move beyond a static inventory spreadsheet and create a workflow where inventory is captured through barcode scanning, synchronized with Google Sheets, and transformed into an interactive AI-powered inventory dashboard with Gemini.
Ready to build your own inventory dashboard?
Start with GearChain , connect your inventory to Google Sheets, and turn your live inventory data into an AI-powered dashboard your team can actually use.