Inventory KPIs: The Metrics Operations Teams Should Track
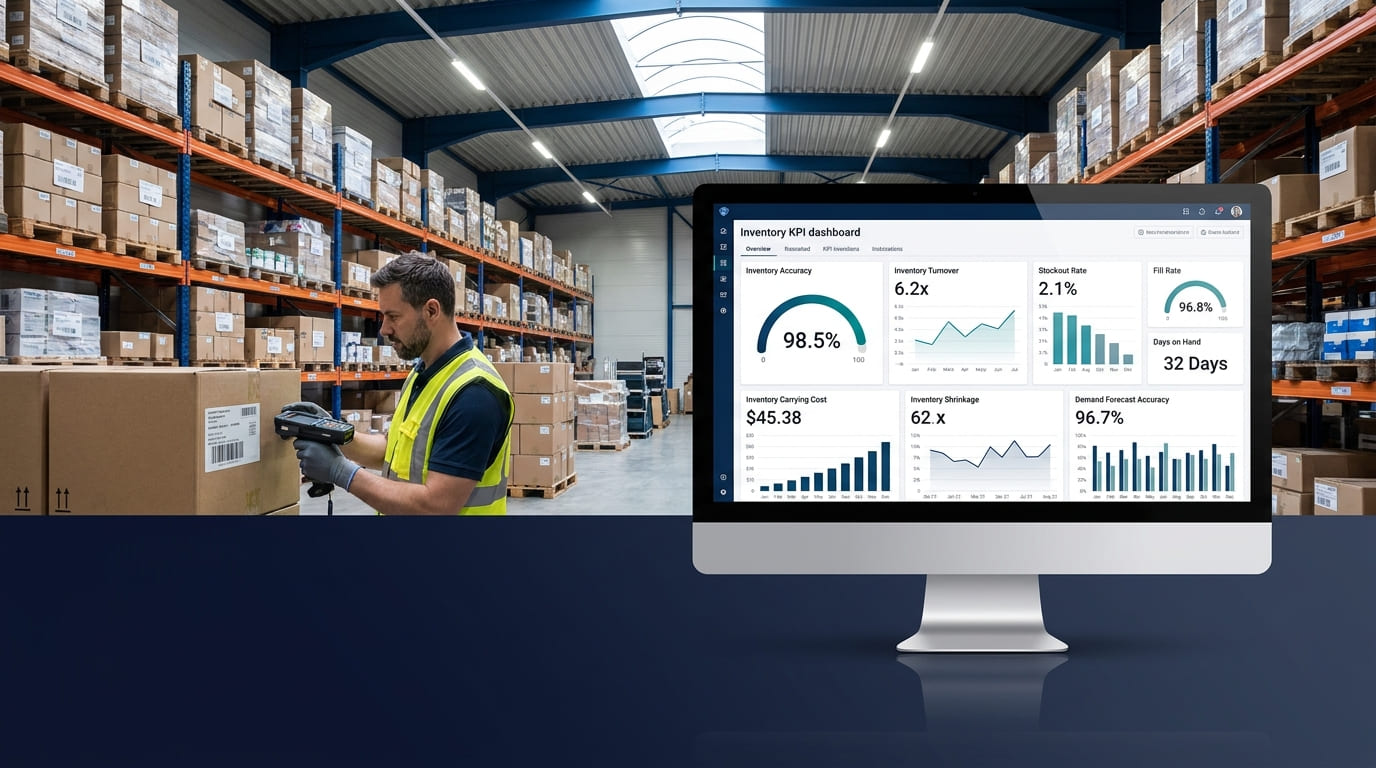
Inventory data becomes useful when it helps an operations team decide what to do next.
Should you reorder an item? Is too much cash tied up in slow-moving stock? Are physical counts matching system records? Are customers waiting because products are unavailable?
Inventory KPIs help answer these questions by turning day-to-day stock activity into measurable signals.
The most useful inventory management metrics are not simply numbers for a dashboard. They help operations teams identify stock problems, understand inventory performance, and take action before small issues become expensive ones.
For most operations, the core inventory KPIs to track are inventory accuracy, inventory turnover, days on hand, stockout rate, fill rate, sell-through rate, inventory carrying cost, shrinkage, forecast accuracy, and backorder rate.
What Are Inventory KPIs?
Inventory KPIs, or inventory key performance indicators, are measurable values used to evaluate how effectively inventory is being tracked, moved, replenished, and controlled.
A useful KPI should answer an operational question.
For example:
An operations team usually gets more value from a focused set of actionable KPIs than from tracking dozens of unrelated warehouse metrics.
1. Inventory Accuracy
Inventory accuracy measures how closely recorded stock matches the physical inventory actually available.
If your system says 500 units are available but a physical count finds only 450, your inventory records are not fully accurate.
This KPI should be a priority because many other inventory performance metrics depend on reliable stock data.
Poor inventory accuracy can lead to unnecessary purchasing, stockouts, picking problems, incorrect replenishment decisions, and unreliable reporting. Accurate records give operations teams a stronger foundation for purchasing and planning.
Regular cycle counts, barcode or QR scanning, clear receiving processes, and consistent recording of stock movements can help improve inventory accuracy.
2. Inventory Turnover
Inventory turnover shows how frequently inventory is sold or used and replaced during a given period.
It is commonly calculated as:
Inventory Turnover = Cost of Goods Sold ÷ Average Inventory
A low inventory turnover ratio can indicate that too much inventory is sitting unused, while higher turnover often indicates faster inventory movement.
However, higher is not always automatically better. If inventory turnover increases while stockout rates are also increasing, the business may be keeping too little stock available.
Operations teams should therefore interpret inventory turnover alongside availability, demand, and replenishment performance rather than treating it as an isolated score.
3. Days of Inventory on Hand
Days on hand, also called days inventory on hand or inventory coverage, estimates how long current stock can support normal demand.
It gives operations teams another way to understand inventory velocity.
If inventory will last only a few days but the supplier requires several weeks to replenish it, the business may be at risk of a stockout.
If inventory coverage is extremely high, the company may be carrying slow-moving or excess stock.
Days on hand becomes especially useful when considered alongside supplier lead time, sales velocity, and seasonal demand.
4. Stockout Rate
The stockout rate measures how often customers, production teams, or internal users need an item that is unavailable.
Stockouts can lead to:
lost sales
delayed customer orders
production interruptions
emergency purchasing
expedited shipping
lower service levels
A rising stockout rate is usually a signal to investigate inventory accuracy, reorder points, supplier lead times, demand forecasting, or safety stock.
Operations teams should also review stockouts by SKU and location. A company may have enough inventory overall while still experiencing shortages at a specific warehouse, store, project, or site.
5. Fill Rate
Fill rate measures how much customer or internal demand can be fulfilled immediately from available inventory.
A high fill rate generally means the operation is maintaining enough stock to meet demand without frequent delays or backorders.
Fill rate and stockout rate should be reviewed together.
If the stockout rate rises while the fill rate falls, the business likely has an inventory availability or replenishment problem.
If fill rate is very high but inventory carrying costs and days on hand are also increasing, the company may be maintaining more inventory than necessary.
The goal is balance, not simply maximizing one KPI.
6. Sell-Through Rate
Sell-through rate helps teams understand how quickly inventory received during a period is being sold or consumed.
It can help identify:
fast-moving inventory
slow-moving inventory
excess stock
changing product demand
purchasing quantities that no longer match usage
A declining sell-through rate can be an early warning that inventory is accumulating.
For operations teams managing many SKUs, tracking sell-through at the product or category level is usually more useful than relying on a single company-wide percentage.
7. Inventory Carrying Cost
Inventory is not free after it enters the warehouse.
Inventory carrying cost, also called holding cost, represents the cost of keeping inventory over time.
Depending on the operation, this can include:
storage
insurance
handling
inventory financing
damage
shrinkage
obsolescence
capital tied up in stock
High carrying costs can indicate that too much working capital is locked in inventory.
This is why operations teams should compare carrying cost with inventory turnover, days on hand, and aging inventory rather than viewing it alone.
GearChain's own inventory guidance similarly emphasizes that excess inventory increases storage costs and ties up working capital.
8. Inventory Shrinkage
Inventory shrinkage is inventory that should be available according to records but cannot be physically accounted for.
Shrinkage can result from:
damage
theft
incorrect receiving
picking mistakes
data-entry errors
missed transfers
unrecorded adjustments
A rising shrinkage rate is both an inventory accuracy problem and an operational control problem.
Teams should investigate recurring variances instead of simply adjusting system quantities. Cycle counting and stock reconciliation can help identify where discrepancies are being created.
9. Demand Forecast Accuracy
Forecast accuracy shows how closely predicted demand matches actual demand.
Poor demand forecasts can create two opposite problems.
Forecast too high, and the business may build excess inventory.
Forecast too low, and the business may face stockouts, emergency purchases, or backorders.
Operations teams should compare forecasts with actual sales or usage and look for consistent forecast bias.
Forecast accuracy is especially important for seasonal products, fast-moving SKUs, long supplier lead times, and inventory that is expensive to store.
10. Backorder Rate
A backorder rate measures how often an order cannot be filled immediately because the required inventory is unavailable.
Backorders provide another view of inventory availability.
Repeated backorders may point to:
poor forecasting
inaccurate inventory records
reorder points set too low
supplier delays
insufficient safety stock
unexpected demand growth
Backorder rate should be reviewed alongside stockout rate and fill rate because all three describe different parts of the same inventory availability problem.
Track KPIs by SKU, Category, and Location
One company-wide number can hide operational problems.
An overall inventory turnover rate may look healthy even when several products have become dead stock.
A company-wide stockout rate may also appear acceptable while one warehouse repeatedly runs short of important items.
Operations teams should therefore segment inventory performance where useful by:
SKU
product category
warehouse
store
site
project
inventory class
fast- and slow-moving items
The right level of detail makes KPI data actionable.
How Inventory KPIs Work Together
No single inventory KPI tells the whole story.
Consider these combinations:
Low inventory accuracy + high stockouts: your replenishment decisions may be based on unreliable stock records.
Low turnover + high days on hand: inventory may be moving too slowly.
High turnover + rising stockouts: inventory may be too lean.
High carrying cost + aging stock: excess or obsolete inventory may be tying up working capital.
Low fill rate + high backorders: available inventory is not keeping pace with demand.
This is why a good inventory dashboard should show relationships, trends, and exceptions—not simply a collection of numbers.
How Often Should Operations Teams Review Inventory KPIs?
Review frequency depends on how quickly inventory moves and how costly a problem would be.
Operational exceptions such as stockouts and low stock may require daily attention.
Inventory accuracy, fill rate, sell-through, and inventory movement may be useful in weekly reviews.
Turnover, days on hand, carrying costs, aging inventory, and forecast performance are often more useful as longer-term trends.
The important point is to review KPIs often enough to change a decision while there is still time to act.
Turn Inventory Data Into Operational Action
Tracking inventory KPIs only works when the underlying data is dependable.
GearChain is designed for operations teams that need faster inventory tracking and more consistent records. The platform supports barcode and NFC scanning, customizable tracking workflows, mobile and web inventory updates, label printing, and synchronization with Google Sheets and Excel.
These capabilities can help teams capture inventory activity closer to where it happens rather than depending entirely on delayed manual updates.
That matters because accurate inventory records support better KPI reporting. If quantities, locations, transfers, receipts, and adjustments are not recorded consistently, inventory dashboards can show precise-looking numbers that do not reflect physical stock.
The goal is not to track more metrics. It is to use reliable inventory data to identify problems and make better operational decisions.
Final Thoughts
The most useful inventory KPIs give operations teams visibility into four things: accuracy, inventory movement, stock availability, and cost.
Inventory accuracy tells you whether the data can be trusted. Inventory turnover and days on hand show how quickly stock moves. Stockout rate, fill rate, and backorders reveal whether inventory is available when needed. Carrying cost, shrinkage, and aging inventory show where stock may be creating unnecessary expense.
Start with the metrics tied to decisions your team can actually influence.
Then review them together rather than trying to optimize one number in isolation.
When accurate inventory data, clear KPI ownership, and regular performance reviews work together, inventory metrics become more than reports—they become tools for improving day-to-day operations.
FAQs
What are inventory KPIs?
Inventory KPIs are measurable indicators used to evaluate inventory accuracy, availability, movement, cost, and replenishment performance. Common examples include inventory turnover, days on hand, stockout rate, fill rate, sell-through rate, carrying cost, shrinkage, and forecast accuracy.
What are the most important inventory KPIs?
The most important inventory KPIs usually include inventory accuracy, inventory turnover, days on hand, stockout rate, fill rate, sell-through rate, carrying cost, shrinkage, forecast accuracy, and backorder rate. The right mix depends on the operation’s goals and risks.
How do you measure inventory performance?
Measure inventory performance by combining accuracy, movement, availability, and cost metrics. Track whether physical inventory matches records, how quickly stock moves, how often items become unavailable, how much demand is fulfilled, and how much inventory costs to hold.
What is inventory turnover?
Inventory turnover measures how frequently a business sells or uses and replaces its inventory during a period. It helps operations teams identify whether stock is moving efficiently or whether too much capital may be tied up in slow-moving inventory.
What is inventory accuracy?
Inventory accuracy measures how closely system inventory records match the stock physically available. High accuracy gives teams more reliable information for replenishment, fulfillment, forecasting, and purchasing, while inaccurate records can contribute to stockouts, overordering, delays, and inventory discrepancies.
How often should inventory KPIs be reviewed?
Inventory KPI review frequency depends on stock velocity and operational risk. Stockouts and availability may require daily monitoring, while accuracy and sell-through can be reviewed weekly. Turnover, carrying cost, inventory aging, and forecast accuracy are often better evaluated as longer-term trends.

Enter email to get Free Google Sheets Template
We’ll email you a quick verification link. Click it to confirm your address and your template will open automatically.
Enter email to get Free Excel Template
We’ll email you a quick verification link. Click it to confirm your address and your template will open automatically.